Free Page Performance Checker Lite
Quick page speed audit: load time, weight, response size. Lightweight Core Web Vitals snapshot. Free, instant.
How to use the Page Performance Checker Lite, step by step
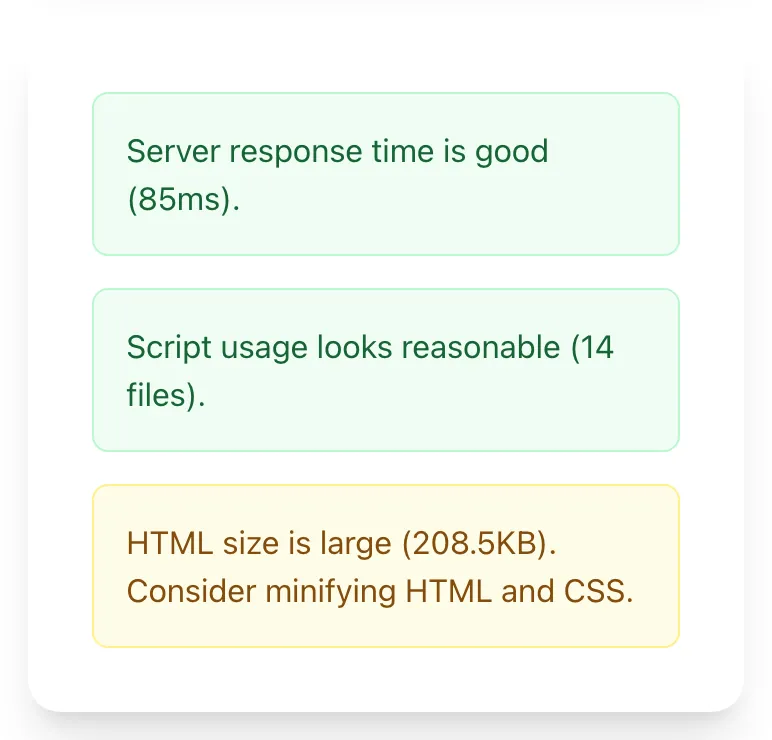
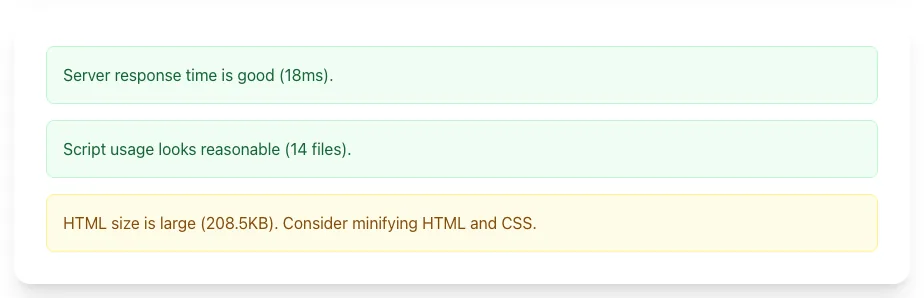
Real screenshots of the tool, taken while running it with the Check Speed button.
- 1
Add your input
Paste or type into the field Page Performance Checker Lite works from.

- 2
A page URL in place
With a page URL entered, Page Performance Checker Lite is ready to run.

- 3
See what Check Speed produces
Clicking Check Speed runs the check and shows the result right below.
What this tool does
Page Performance Checker Lite delivers fast, reliable results for quick page speed audit: load time, weight, response size. lightweight core web vitals snapshot. free, instant.
Designed to fit into your existing SEO and content workflow with no setup overhead.
How to use it
Five steps.
Paste your URL
Enter any public URL; the tool runs a Lighthouse-based audit from a clean browser instance.
Read the metrics
See LCP, INP, CLS, FCP, and TTFB with color-coded thresholds.
Inspect the breakdown
Identify the LCP element, slowest scripts, and CLS sources to focus your fixes.
Review recommendations
Use the metric breakdown to identify the first fix to make.
Re-run after deploys
Verify each fix actually moves the metric in the right direction before declaring victory.
When teams use it
Six common workflows.
Engineering teams shipping daily
Run a quick performance check on every staging URL before deploying to production to catch regressions early.
SEO consultants delivering technical audits
Identify the top 10-20 pages with poor Core Web Vitals and quantify the ranking risk in client deliverables.
Product managers benchmarking competitors
Run the same checker on your homepage and three competitors to spot opportunity gaps for marketing positioning.
Designers verifying mockup decisions
Confirm that hero image and font choices do not blow LCP budgets before committing the design to engineering.
Marketers optimizing ad landing pages
Check landing page performance pre-launch so paid traffic does not bounce due to slow load.
CTOs reporting to leadership
Pull a quick performance score for board updates without spinning up a full monitoring suite.
Platform guides
Integrate with major platforms.
Google PageSpeed Insights
- Visit pagespeed.web.dev.
- Paste your URL and click Analyze.
- Review the field data (top) and lab data (below).
- Click any opportunity to see specific recommendations.
Lighthouse CLI
- Install via npm: npm install -g lighthouse.
- Run: lighthouse https://example.com --view.
- Get an HTML report locally without depending on a hosted service.
- Use --preset=desktop or --form-factor=desktop for desktop runs.
Lighthouse CI
- Add @lhci/cli to your CI config.
- Define performance budgets in lighthouserc.js (LCP, JS bundle, etc.).
- Run lhci autorun on each pull request.
- Fail the build if any budget is exceeded.
WebPageTest
- Visit webpagetest.org.
- Enter URL, choose location, browser, connection profile.
- Click Start Test and wait 30-60 seconds.
- Use the filmstrip view to see exactly when each visual element appears.
Chrome DevTools
- Open the page and press F12.
- Go to the Performance tab and click Record.
- Reload the page; stop the recording.
- Inspect the flame graph for long tasks, layout shifts, and render-blocking resources.
Grigora vs. alternatives
Side-by-side.
| Capability | Grigora | PageSpeed Insights | WebPageTest | Free | Manual |
|---|---|---|---|---|---|
| LCP, INP, CLS measurement | Yes | Yes | Yes | Lab only | Manual |
| Mobile + desktop side-by-side | Yes | Toggled | Yes | No | Manual |
| Field data via CrUX | Yes | Yes | Paid tier | No | No |
| Element-level LCP attribution | Yes | Yes | Yes | Limited | DevTools |
| JavaScript bundle breakdown | Yes | Limited | Yes | Yes | Manual |
| Free without signup | Yes | Yes | Free tier | Yes | N/A |
| Third-party script profiling | Yes | Limited | Yes | Limited | Manual |
| CI/CD integration | Coming soon | CLI only | API | No | Custom |
Common errors and fixes
Eight issues users hit.
LCP element is a slow-loading hero image
Cause: The hero image is large, lazy-loaded, or served from a slow origin.
Fix: Preload the image with <link rel="preload">, serve as AVIF or WebP at the rendered size, and ensure not lazy-loaded.
INP regression from new analytics script
Cause: A third-party script blocks the main thread for 300+ ms during interaction.
Fix: Defer the script with async or use Partytown to move it to a Web Worker; remove if not essential.
CLS spike from cookie consent banner
Cause: The banner inserts above existing content after page load, pushing everything down.
Fix: Render the banner with a fixed position and reserved height, or load it immediately in the initial HTML.
TTFB over 1 second
Cause: Server-side rendering with a slow database query or no edge caching.
Fix: Cache the response at the CDN, optimize the slow query, or move the page to static generation if data does not change frequently.
Render-blocking JavaScript in head
Cause: Synchronous <script> tags load before HTML parsing continues.
Fix: Add async or defer attributes, or move scripts to the end of body when possible.
Web font causes FOIT
Cause: Font is set to font-display: block (default), hiding text until font loads.
Fix: Add font-display: swap or font-display: optional to your @font-face rule.
Missing image dimensions cause CLS
Cause: Images do not have width and height attributes.
Fix: Add explicit width and height to every <img> tag, or use aspect-ratio CSS for responsive images.
Slow Lighthouse score on local dev but fast in production
Cause: Lighthouse runs against a Webpack dev build with no minification or code splitting.
Fix: Always test against a production build; use a staging URL for accurate measurements.
Original data
2026 study.
Frequently asked questions
Twelve answers.
Related free tools
Other utilities.
Meta Viewport Checker
Check the viewport tag that controls mobile rendering.
Try itMixed Content Checker
Find http assets loading on an https page.
Try itMeta Tag Generator
Generate page meta tags.
Try itMeta Description Generator
AI-write descriptions.
Try itSERP Snippet Preview
Visualize SERP rendering.
Try itOpen Graph Checker
Audit OG tags.
Try itMeta Title Checker
Audit page title.
Try itLink Metadata Scraper
Pull all metadata from URL.
Try itWebsite Grader
Grade speed, SEO, security, mobile and customer essentials out of 100.
Try it